

Digital vehicle marketplace OPENLANE (NYSE:KAR) reported Q2 CY2025 results topping the market’s revenue expectations, with sales up 8.5% year on year to $481.7 million. Its non-GAAP profit of $0.33 per share was 50% above analysts’ consensus estimates.
Is now the time to buy OPENLANE? Find out by accessing our full research report, it’s free.
OPENLANE (KAR) Q2 CY2025 Highlights:
- Revenue: $481.7 million vs analyst estimates of $454.9 million (8.5% year-on-year growth, 5.9% beat)
- Adjusted EPS: $0.33 vs analyst estimates of $0.22 (50% beat)
- Adjusted EBITDA: $86.7 million vs analyst estimates of $73.84 million (18% margin, 17.4% beat)
- Management raised its full-year Adjusted EPS guidance to $1.15 at the midpoint, a 20.5% increase
- EBITDA guidance for the full year is $315 million at the midpoint, above analyst estimates of $303.1 million
- Operating Margin: 9.8%, down from 12.6% in the same quarter last year
- Free Cash Flow Margin: 11.9%, up from 5.5% in the same quarter last year
- Market Capitalization: $2.69 billion
"OPENLANE delivered a very strong second quarter, growing auction fee revenue by 24%, delivering $87 million in Adjusted EBITDA and generating $87 million in Adjusted Free Cash Flow," said Peter Kelly, CEO of OPENLANE.
Company Overview
Facilitating the sale of approximately 1.3 million used vehicles in 2023, OPENLANE (NYSE:KAR) operates digital marketplaces that connect sellers and buyers of used vehicles across North America and Europe, facilitating wholesale transactions.
Revenue Growth
A company’s long-term sales performance can indicate its overall quality. Any business can have short-term success, but a top-tier one grows for years.
With $1.86 billion in revenue over the past 12 months, OPENLANE is a mid-sized business services company, which sometimes brings disadvantages compared to larger competitors benefiting from better economies of scale.
As you can see below, OPENLANE’s revenue declined by 5.3% per year over the last five years, a tough starting point for our analysis.
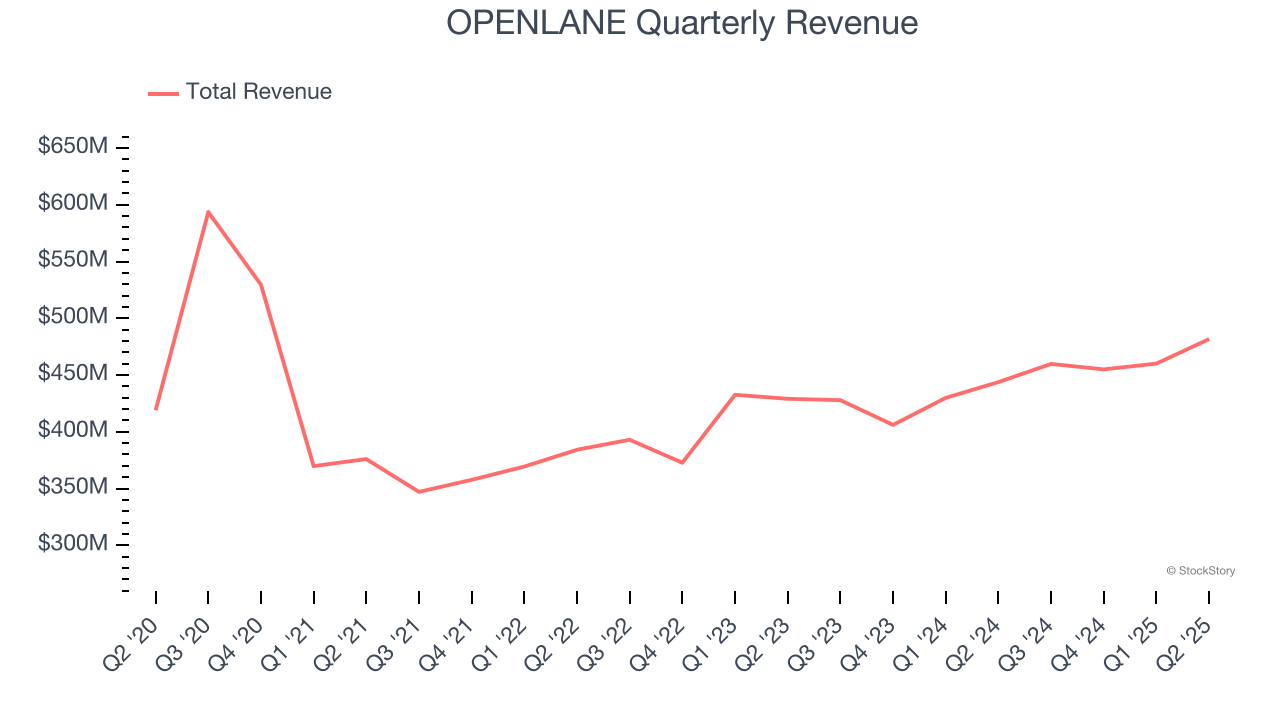
Long-term growth is the most important, but within business services, a half-decade historical view may miss new innovations or demand cycles. OPENLANE’s annualized revenue growth of 6.8% over the last two years is above its five-year trend, suggesting some bright spots. 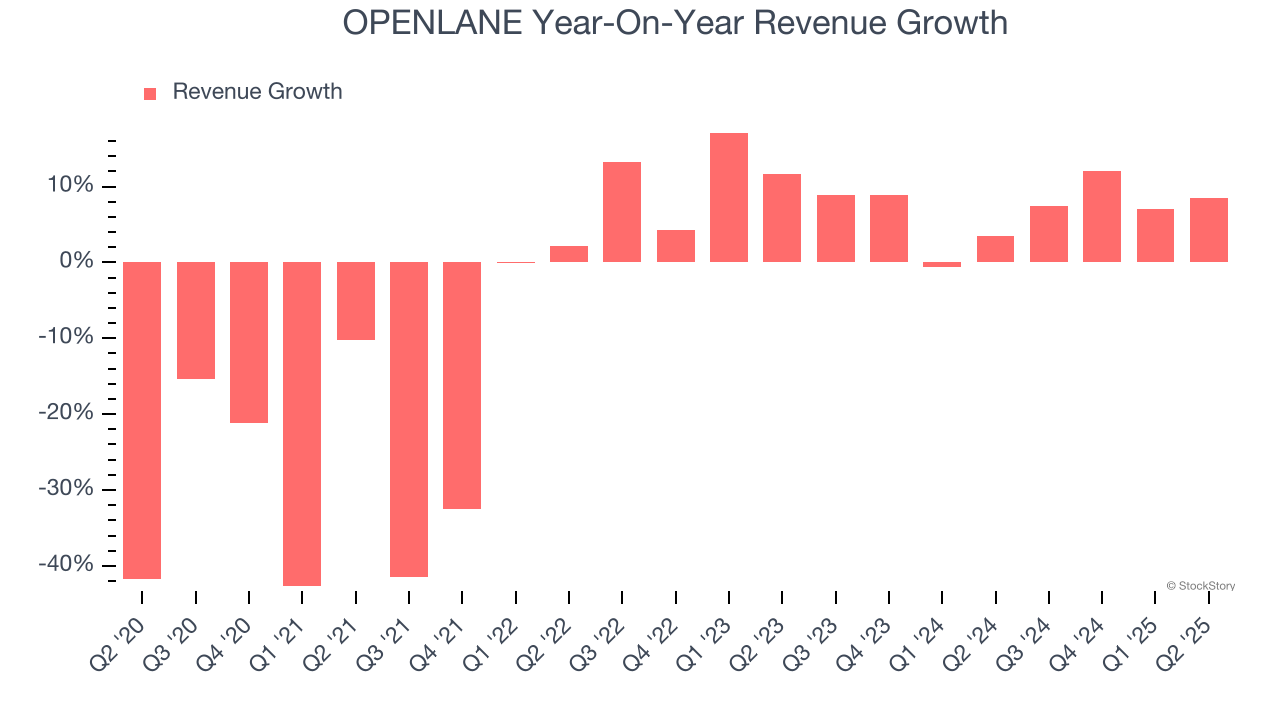
This quarter, OPENLANE reported year-on-year revenue growth of 8.5%, and its $481.7 million of revenue exceeded Wall Street’s estimates by 5.9%.
Looking ahead, sell-side analysts expect revenue to decline by 1.4% over the next 12 months, a deceleration versus the last two years. This projection is underwhelming and implies its products and services will see some demand headwinds.
Here at StockStory, we certainly understand the potential of thematic investing. Diverse winners from Microsoft (MSFT) to Alphabet (GOOG), Coca-Cola (KO) to Monster Beverage (MNST) could all have been identified as promising growth stories with a megatrend driving the growth. So, in that spirit, we’ve identified a relatively under-the-radar profitable growth stock benefiting from the rise of AI, available to you FREE via this link.
Operating Margin
OPENLANE was profitable over the last five years but held back by its large cost base. Its average operating margin of 8.3% was weak for a business services business.
On the plus side, OPENLANE’s operating margin rose by 4.7 percentage points over the last five years.
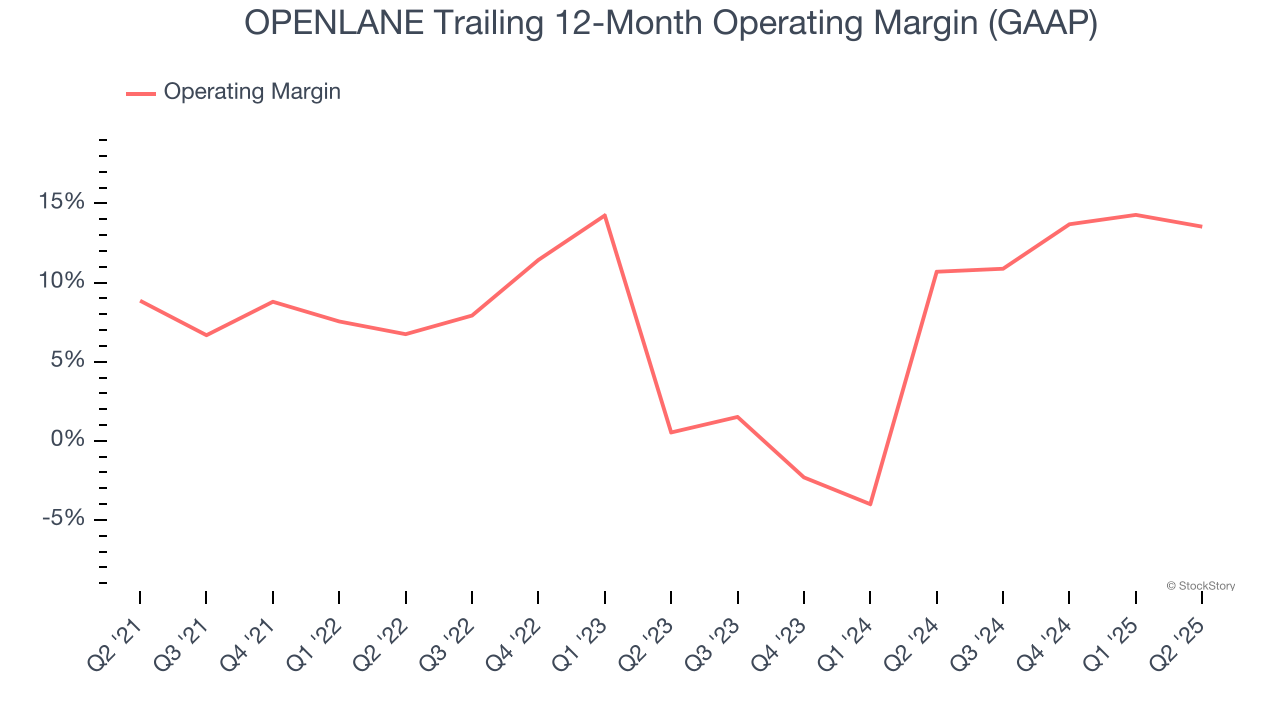
In Q2, OPENLANE generated an operating margin profit margin of 9.8%, down 2.7 percentage points year on year. This contraction shows it was less efficient because its expenses grew faster than its revenue.
Earnings Per Share
Revenue trends explain a company’s historical growth, but the long-term change in earnings per share (EPS) points to the profitability of that growth – for example, a company could inflate its sales through excessive spending on advertising and promotions.
OPENLANE’s EPS grew at a solid 9.3% compounded annual growth rate over the last five years, higher than its 5.3% annualized revenue declines. This tells us management adapted its cost structure in response to a challenging demand environment.
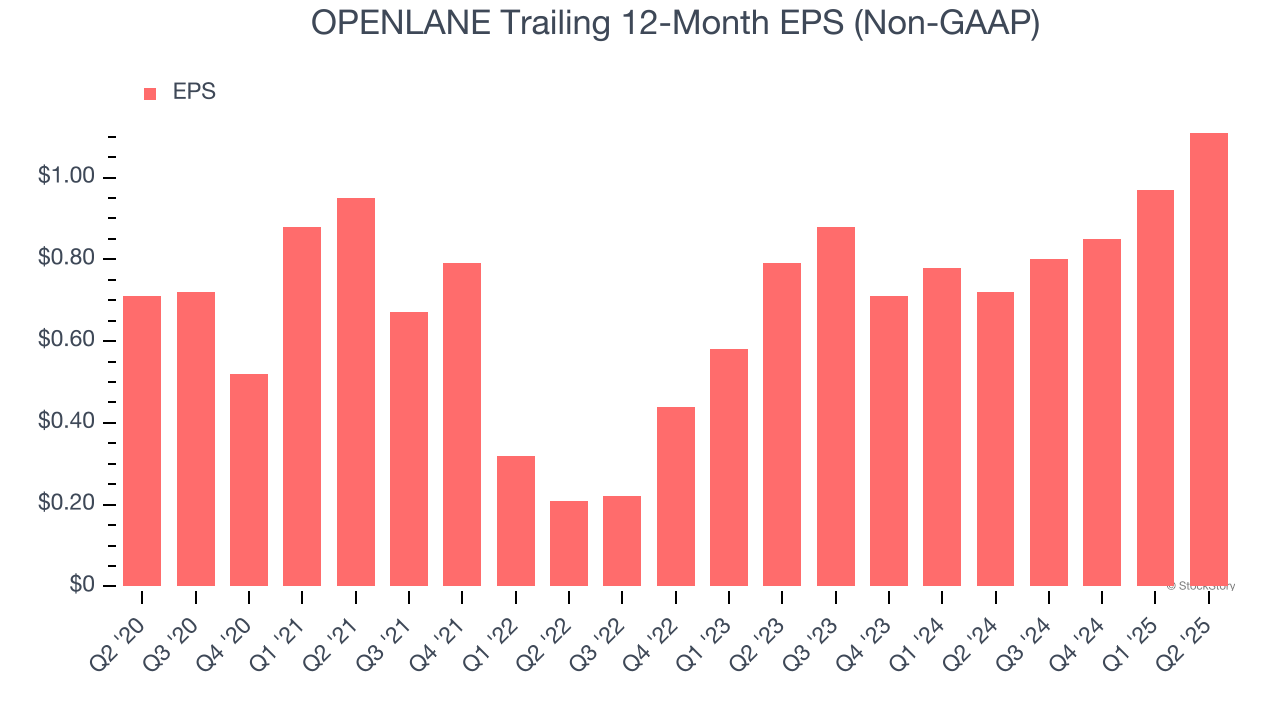
We can take a deeper look into OPENLANE’s earnings quality to better understand the drivers of its performance. As we mentioned earlier, OPENLANE’s operating margin declined this quarter but expanded by 4.7 percentage points over the last five years. This was the most relevant factor (aside from the revenue impact) behind its higher earnings; interest expenses and taxes can also affect EPS but don’t tell us as much about a company’s fundamentals.
Like with revenue, we analyze EPS over a more recent period because it can provide insight into an emerging theme or development for the business.
For OPENLANE, its two-year annual EPS growth of 18.5% was higher than its five-year trend. We love it when earnings growth accelerates, especially when it accelerates off an already high base.
In Q2, OPENLANE reported adjusted EPS at $0.33, up from $0.19 in the same quarter last year. This print easily cleared analysts’ estimates, and shareholders should be content with the results. Over the next 12 months, Wall Street expects OPENLANE’s full-year EPS of $1.11 to shrink by 16.4%.
Key Takeaways from OPENLANE’s Q2 Results
We were impressed by how significantly OPENLANE blew past analysts’ EPS expectations this quarter. We were also excited its revenue outperformed Wall Street’s estimates by a wide margin and it raised its guidance. Zooming out, we think this quarter featured some important positives. The stock traded up 4.8% to $26.25 immediately following the results.
OPENLANE had an encouraging quarter, but one earnings result doesn’t necessarily make the stock a buy. Let’s see if this is a good investment. We think that the latest quarter is only one piece of the longer-term business quality puzzle. Quality, when combined with valuation, can help determine if the stock is a buy. We cover that in our actionable full research report which you can read here, it’s free.