

Real estate brokerage and services firm Marcus & Millichap (NYSE:MMI) reported Q2 CY2025 results topping the market’s revenue expectations, with sales up 8.8% year on year to $172.3 million. Its GAAP loss of $0.28 per share was significantly below analysts’ consensus estimates.
Is now the time to buy Marcus & Millichap? Find out by accessing our full research report, it’s free.
Marcus & Millichap (MMI) Q2 CY2025 Highlights:
- Revenue: $172.3 million vs analyst estimates of $163.6 million (8.8% year-on-year growth, 5.3% beat)
- EPS (GAAP): -$0.28 vs analyst estimates of -$0.10 (significant miss)
- Adjusted EBITDA: $1.46 million vs analyst estimates of -$5.25 million (0.8% margin, significant beat)
- Operating Margin: -5.3%, in line with the same quarter last year
- Market Capitalization: $1.26 billion
“Our second-quarter results reflect the resilience and adaptability of our platform during a period of continued global market volatility and tariff-related uncertainty,” said Hessam Nadji, President and Chief Executive Officer of Marcus & Millichap.
Company Overview
Founded in 1971, Marcus & Millichap (NYSE:MMI) specializes in commercial real estate investment sales, financing, research, and advisory services.
Revenue Growth
A company’s long-term sales performance is one signal of its overall quality. Even a bad business can shine for one or two quarters, but a top-tier one grows for years. Unfortunately, Marcus & Millichap struggled to consistently increase demand as its $725.9 million of sales for the trailing 12 months was close to its revenue five years ago. This was below our standards and is a sign of poor business quality.
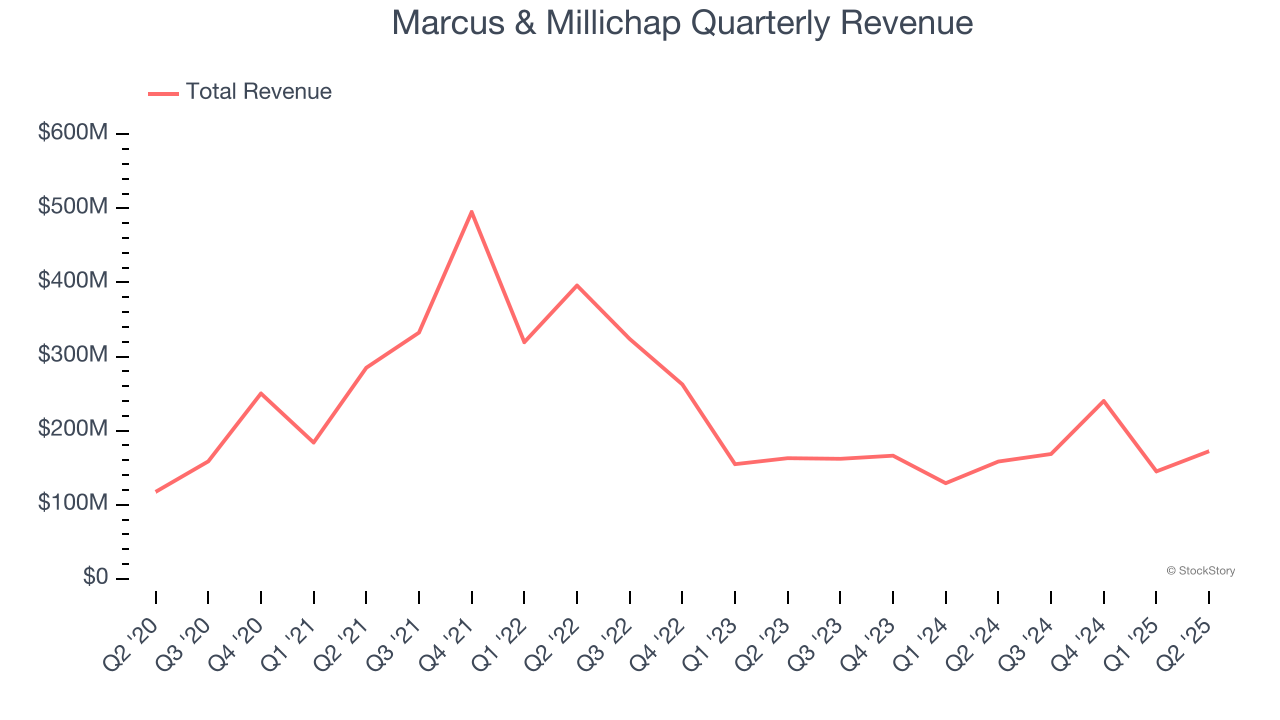
Long-term growth is the most important, but within consumer discretionary, product cycles are short and revenue can be hit-driven due to rapidly changing trends and consumer preferences. Marcus & Millichap’s recent performance shows its demand remained suppressed as its revenue has declined by 10.4% annually over the last two years. 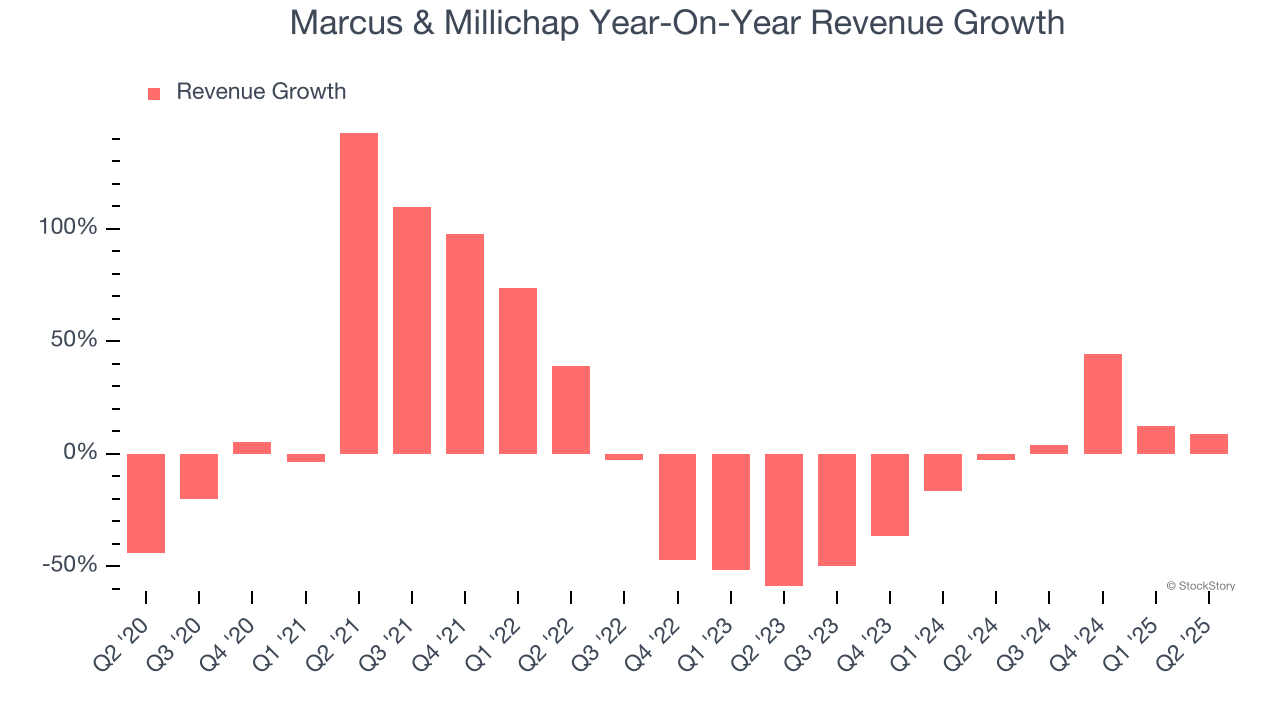
We can better understand the company’s revenue dynamics by analyzing its most important segments, Brokerage and Financing, which are 82.1% and 15.2% of revenue. Over the last two years, Marcus & Millichap’s Brokerage revenue (commission fees) averaged 8.7% year-on-year growth while its Financing revenue (financing fees) averaged 34.7% growth. 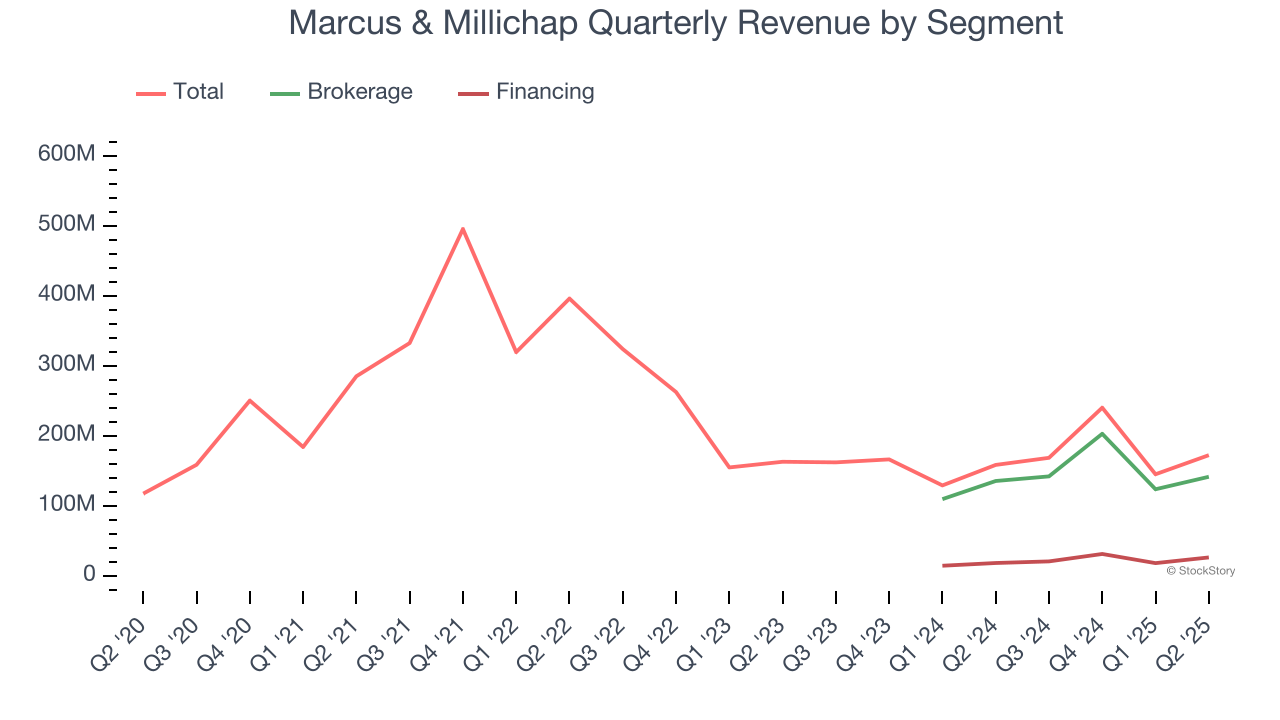
This quarter, Marcus & Millichap reported year-on-year revenue growth of 8.8%, and its $172.3 million of revenue exceeded Wall Street’s estimates by 5.3%.
Looking ahead, sell-side analysts expect revenue to grow 10.7% over the next 12 months. While this projection indicates its newer products and services will catalyze better top-line performance, it is still below average for the sector.
Here at StockStory, we certainly understand the potential of thematic investing. Diverse winners from Microsoft (MSFT) to Alphabet (GOOG), Coca-Cola (KO) to Monster Beverage (MNST) could all have been identified as promising growth stories with a megatrend driving the growth. So, in that spirit, we’ve identified a relatively under-the-radar profitable growth stock benefiting from the rise of AI, available to you FREE via this link.
Operating Margin
Marcus & Millichap’s operating margin has been trending up over the last 12 months, but it still averaged negative 6.9% over the last two years. This is due to its large expense base and inefficient cost structure.
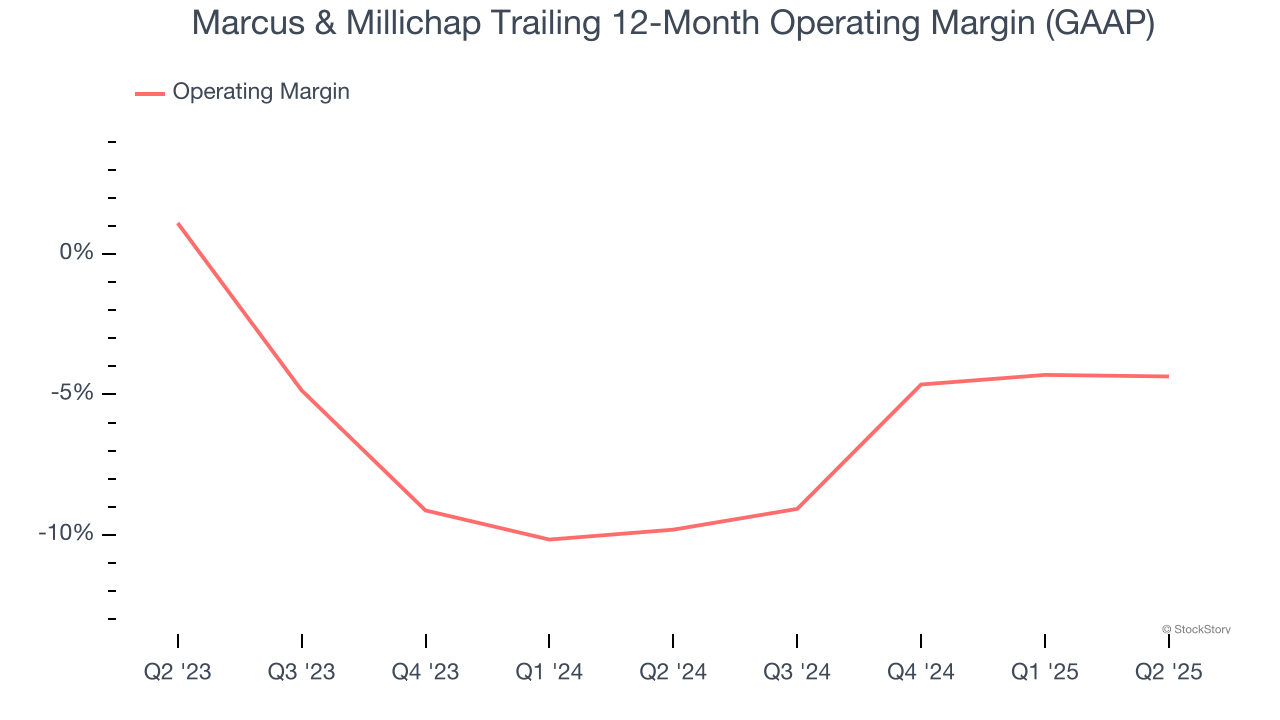
This quarter, Marcus & Millichap generated a negative 5.3% operating margin. The company's consistent lack of profits raise a flag.
Earnings Per Share
Revenue trends explain a company’s historical growth, but the long-term change in earnings per share (EPS) points to the profitability of that growth – for example, a company could inflate its sales through excessive spending on advertising and promotions.
Sadly for Marcus & Millichap, its EPS declined by 17.4% annually over the last five years while its revenue was flat. This tells us the company struggled because its fixed cost base made it difficult to adjust to choppy demand.
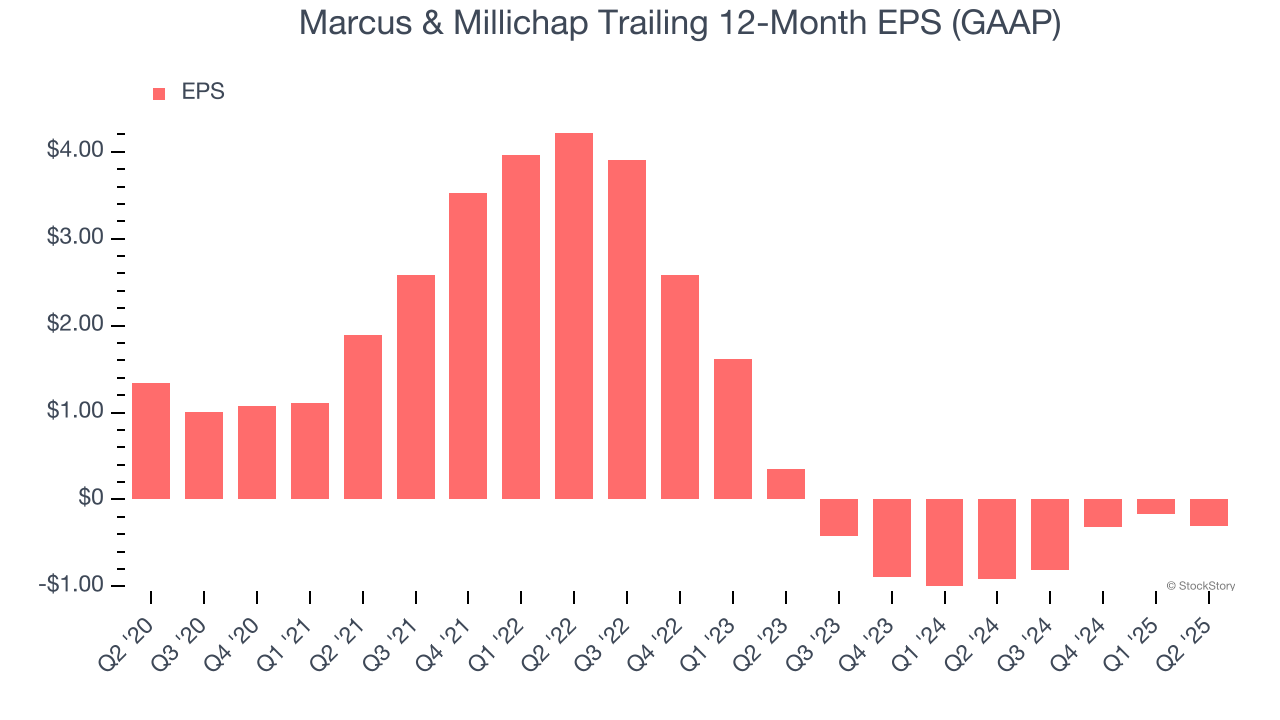
In Q2, Marcus & Millichap reported EPS at negative $0.28, down from negative $0.14 in the same quarter last year. This print missed analysts’ estimates. Over the next 12 months, Wall Street is optimistic. Analysts forecast Marcus & Millichap’s full-year EPS of negative $0.31 will reach break even.
Key Takeaways from Marcus & Millichap’s Q2 Results
We were impressed by how significantly Marcus & Millichap blew past analysts’ EBITDA expectations this quarter. We were also glad its revenue outperformed Wall Street’s estimates. On the other hand, its EPS missed. Overall, this print had some key positives. Investors were likely hoping for more, and shares traded down 11.6% to $28.45 immediately following the results.
So do we think Marcus & Millichap is an attractive buy at the current price? When making that decision, it’s important to consider its valuation, business qualities, as well as what has happened in the latest quarter. We cover that in our actionable full research report which you can read here, it’s free.